
Aditya Khuntia
B.Tech, Mathematics & Computing Engineering
Delhi Technological University
Saarathi


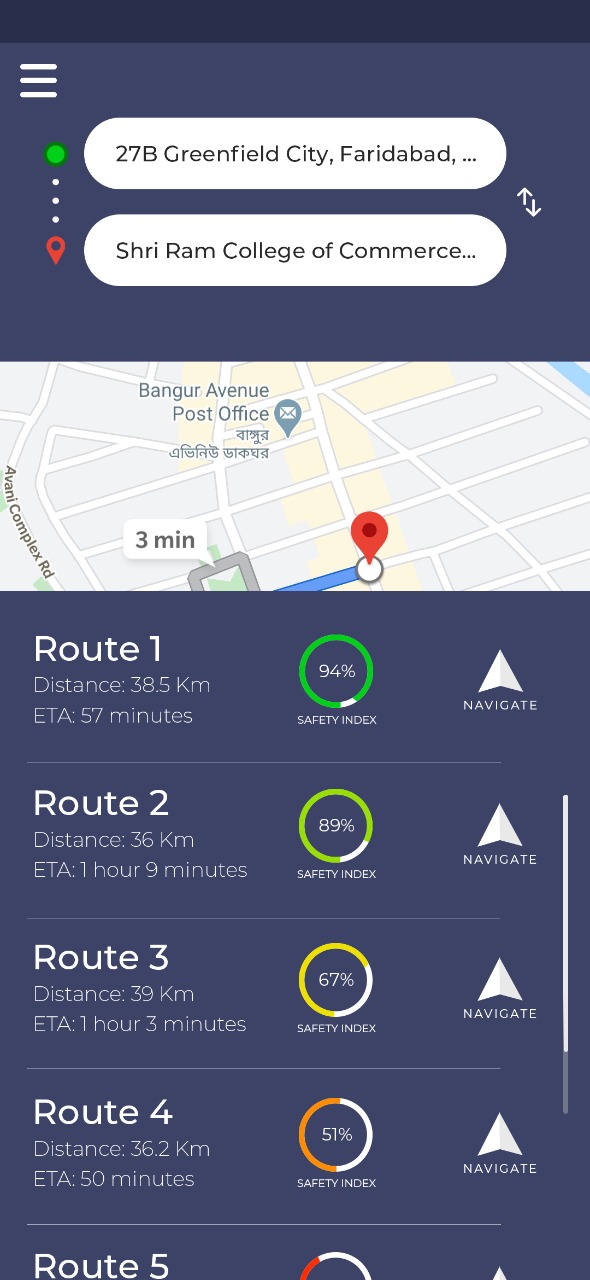
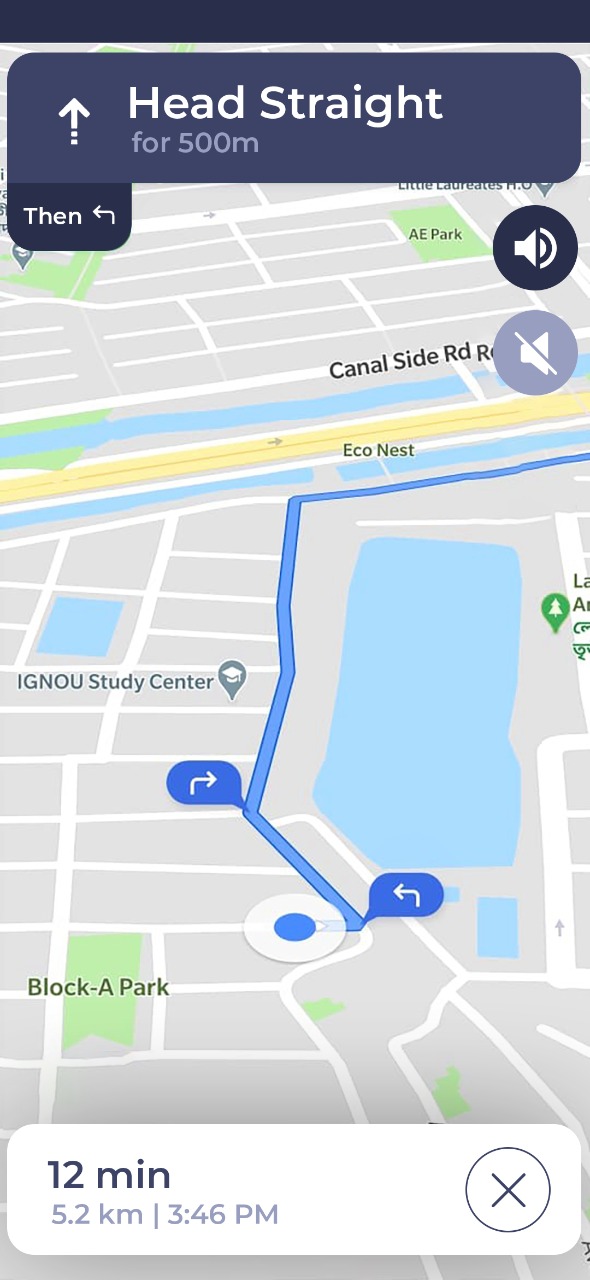

Saarathi is a mobile application developed as a social welfare initiative in response to COVID-19 in India. The app aims to ensure the safety of the Indian population during the COVID-unlock phase by providing navigation solutions. After India's strict lockdown, the app addresses the challenge of navigating safely amidst the current precarious situation by pinpointing COVID-prone areas using six versatile factors. It utilises comprehensive algorithms to assess routes and guide users safely to their destinations. The app draws an analogy to Krishna guiding Arjun in the Mahabharata, symbolising its aim to steer people away from dangers posed by COVID.
Algorithms
Routing — Waypoint Routing
The traditional problem with routing is that it is difficult to provide a complete solution because routing engine services only provide the best paths (time-wise), missing the route which might have been the safest. Using the Google API, for example, we get only 3 routes maximum. To get all possible routes between the origin and the destination, we use a recursive algorithm — we reroute on waypoints. On a given route, we try to find new directions on every turn, leading to an exponential rise in the number of routes considered.
Population Density
Uses data from EU's GHSL calculations, which estimates population density based on satellite imaging and India's census surveys at a resolution yielding data for tiles as small as 0.07 km². Along each route, we evaluate every point on the road and assign it a population density danger rating modelled by a bell curve — danger increases with population density until saturation:
Covid Points
Uses district-wise COVID case data made public by the government to keep people away from infested areas. We compute each district's COVID threat (DCT), then normalise by the highest DCT along the route so the algorithm remains comparative rather than absolute:
Point Avoid
Thousands of coordinates across India describing the location of hospitals, public transport spots, non-sanitary areas, and other hotspots are assigned a weightage according to danger. The cumulative danger effect on a point is fitted to a logistic model:
To increase time efficiency, all locations are geohashed — India is divided into area-wise sectors and assigned codes. Only locations in the vicinity of a point are accessed for calculations, arranged into a dictionary for fast lookup.
Containment Zones
Fetches government data on declared containment zones and uses ray casting to determine if any point on a route lies inside a containment polygon. If so, that route is eliminated from consideration:
Traffic
A database of all roads in India is updated every 10 minutes. The jamming factor (JF, 0–10) for each road is mapped directly to a point rating:
Temperature & Humidity
The coronavirus R-value is influenced by temperature and humidity. As temperature rises and humidity decreases, transmission generally slows.
Temperature relationship:
Humidity relationship:
Combined risk:
Rating & Combination
For algorithms that produce point-level ratings, we aggregate them into a route rating by fitting a probability density function to the frequency distribution of ratings (bracket width 0.005) and computing its expected value:
Integrated Algorithm
To determine the weightage of each of the six algorithms, we generated test data where backend developers chose between two routes with arbitrary algorithm values. A machine learning model learned the implicit preferences and output a percentage importance for each algorithm.
Senior Guidance & Contributors

Pragyan Pandey

Garvit Goswami

Resham Talwar

Kunaal Gautam